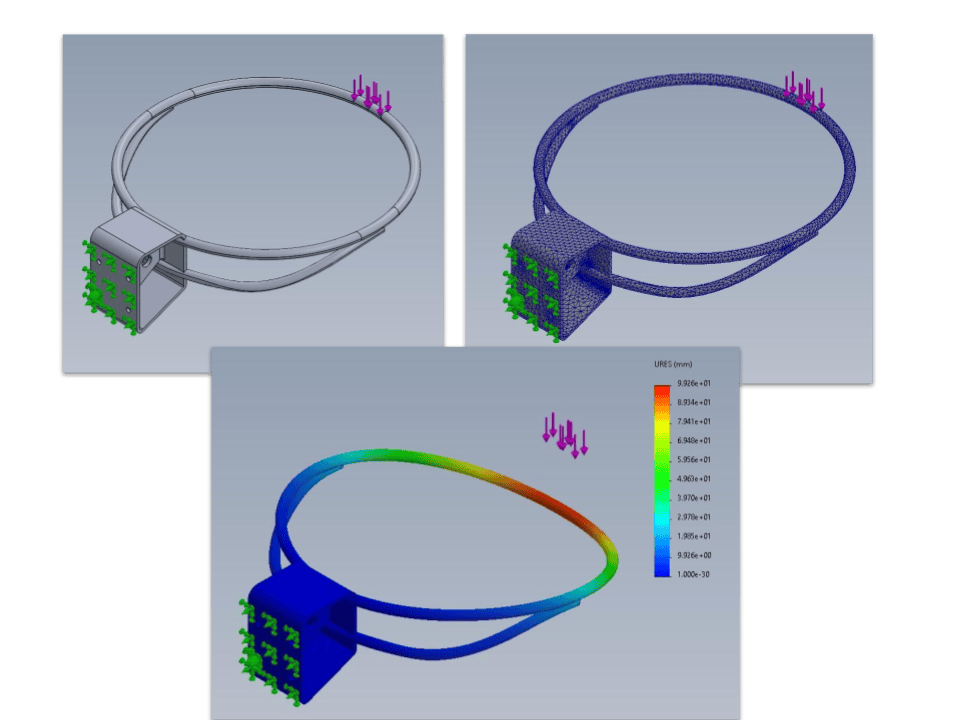
- Analyze a structure under repeated loading conditions using the Fatigue module.
- Apply S-N curves to materials for repetitive loading analysis.
- Apply correction factors for more realistic results.
- View damage plots to analyze material life.
In this example, a basketball rim will be analyzed for predicted fatigue damage after undergoing 10,000 cycles of an applied load of 1000N in order to determine:
- the stress state of a single load
- how many cycles the basketball rim can withstand before the predicted onset of yield
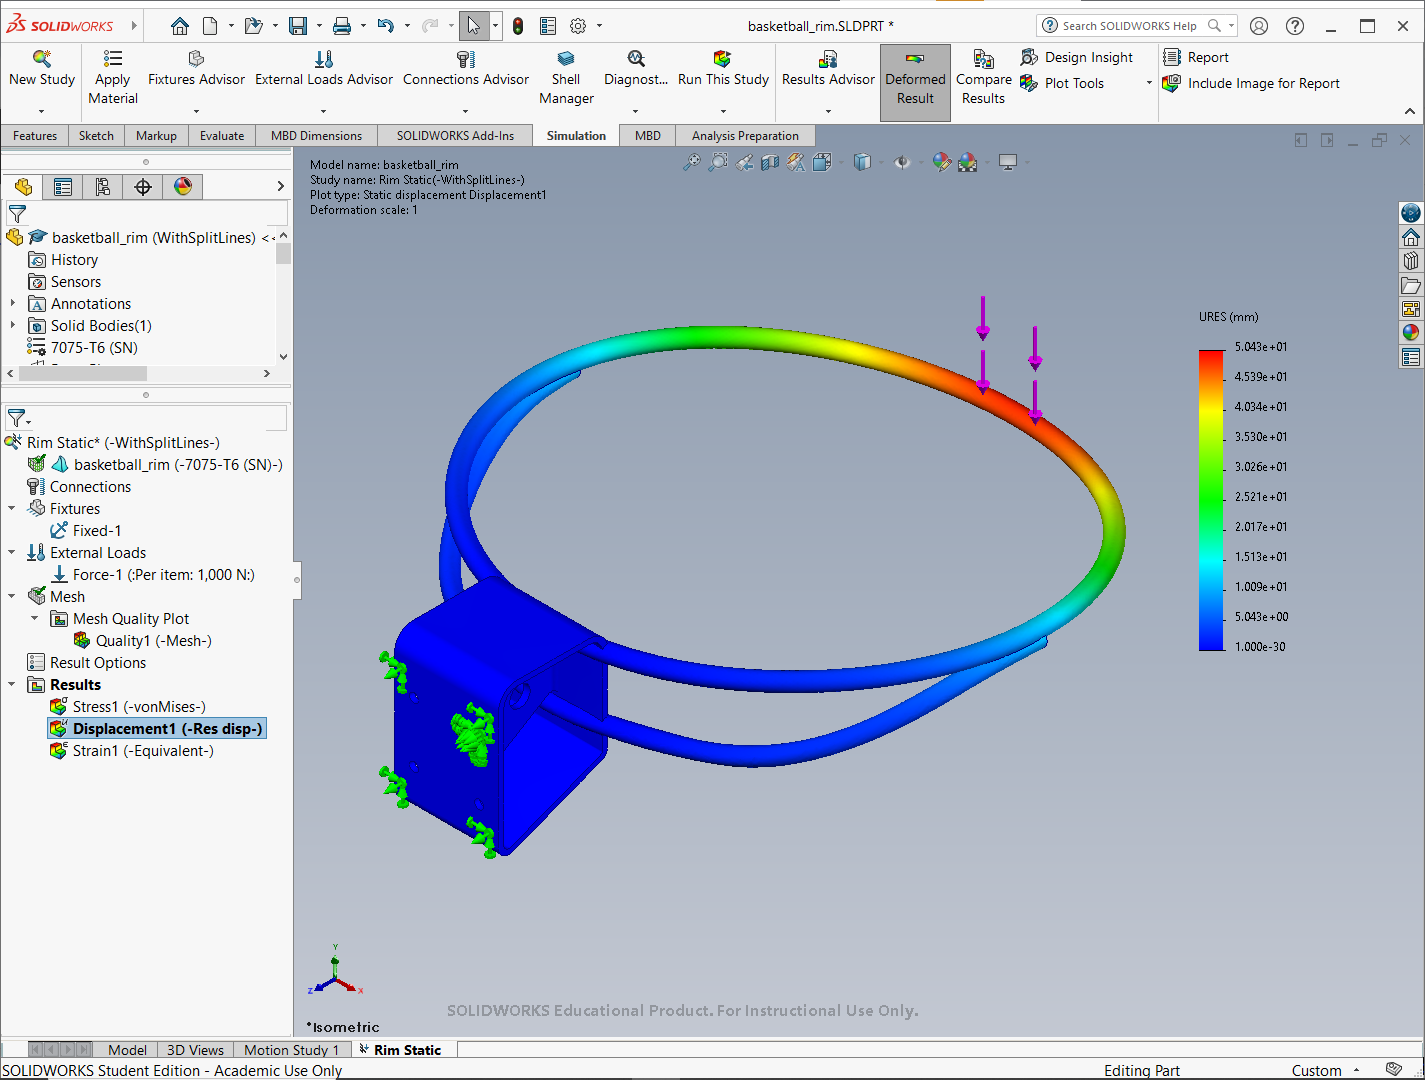
Fixtures and loads
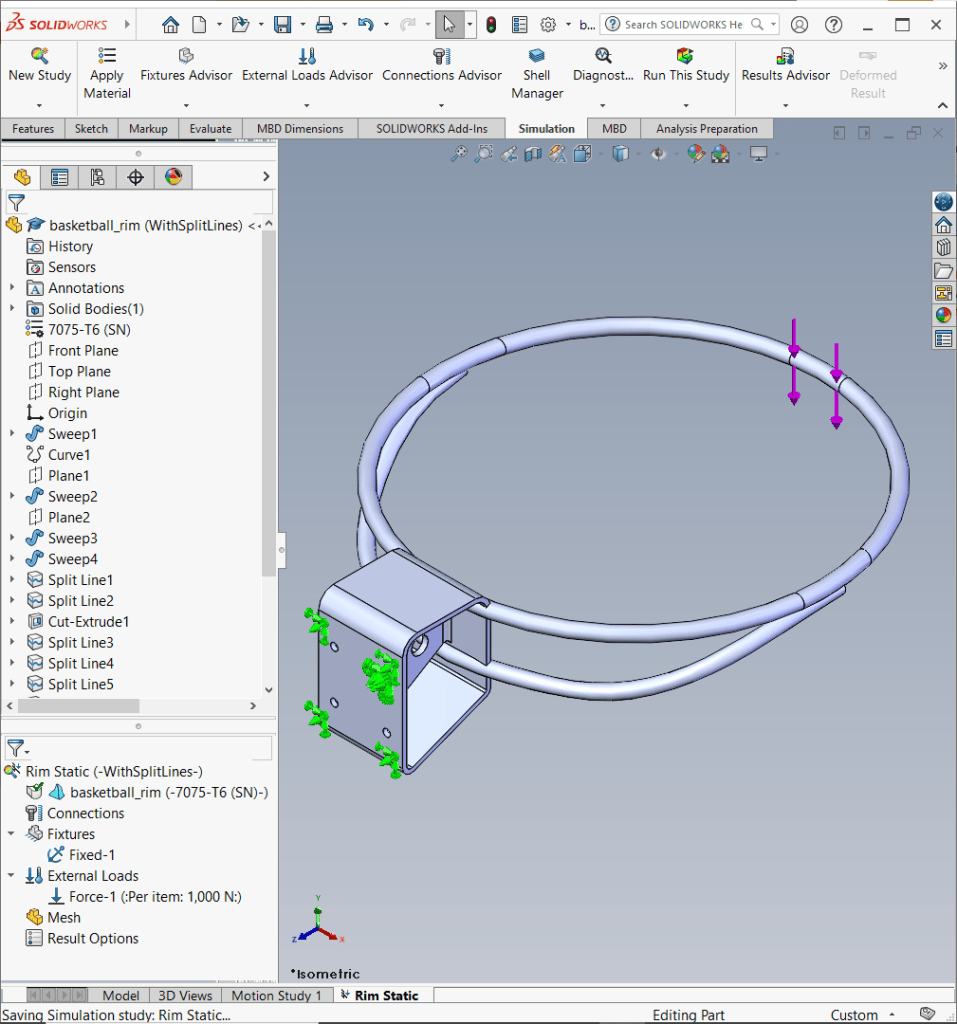
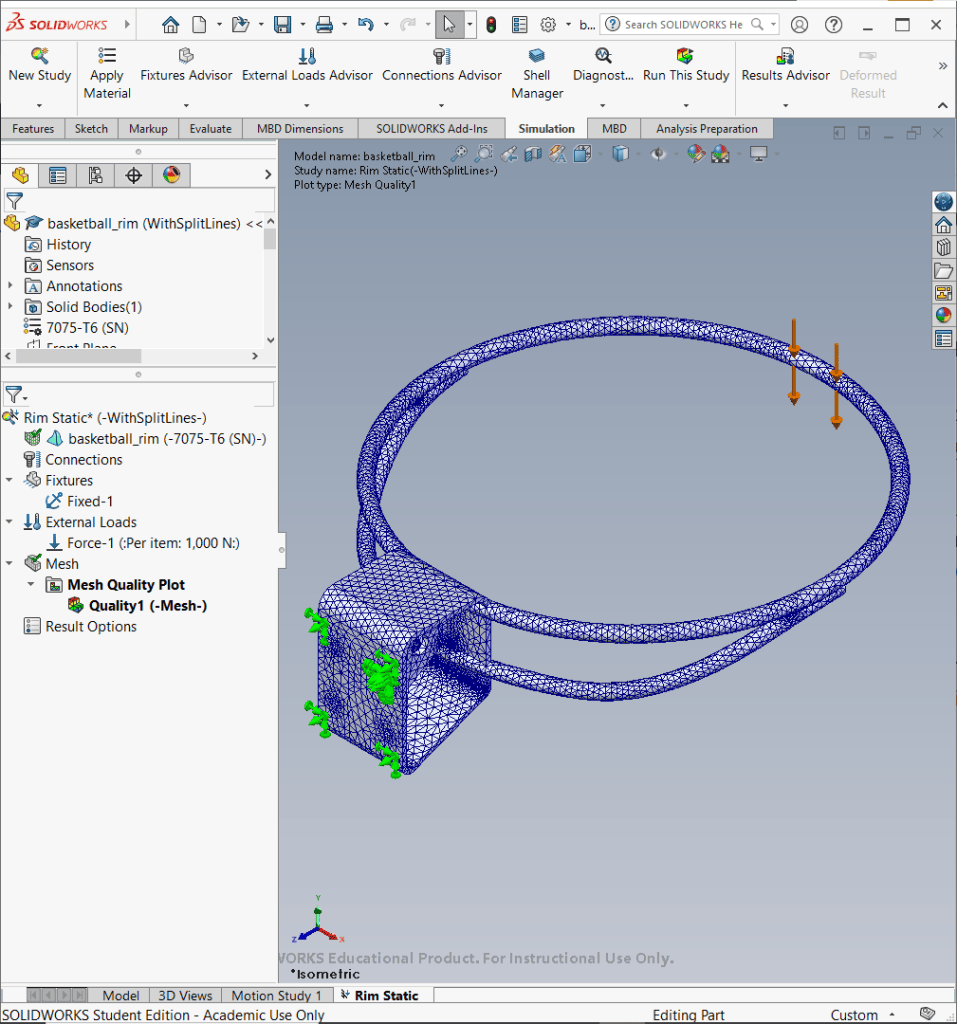
Mesh plot
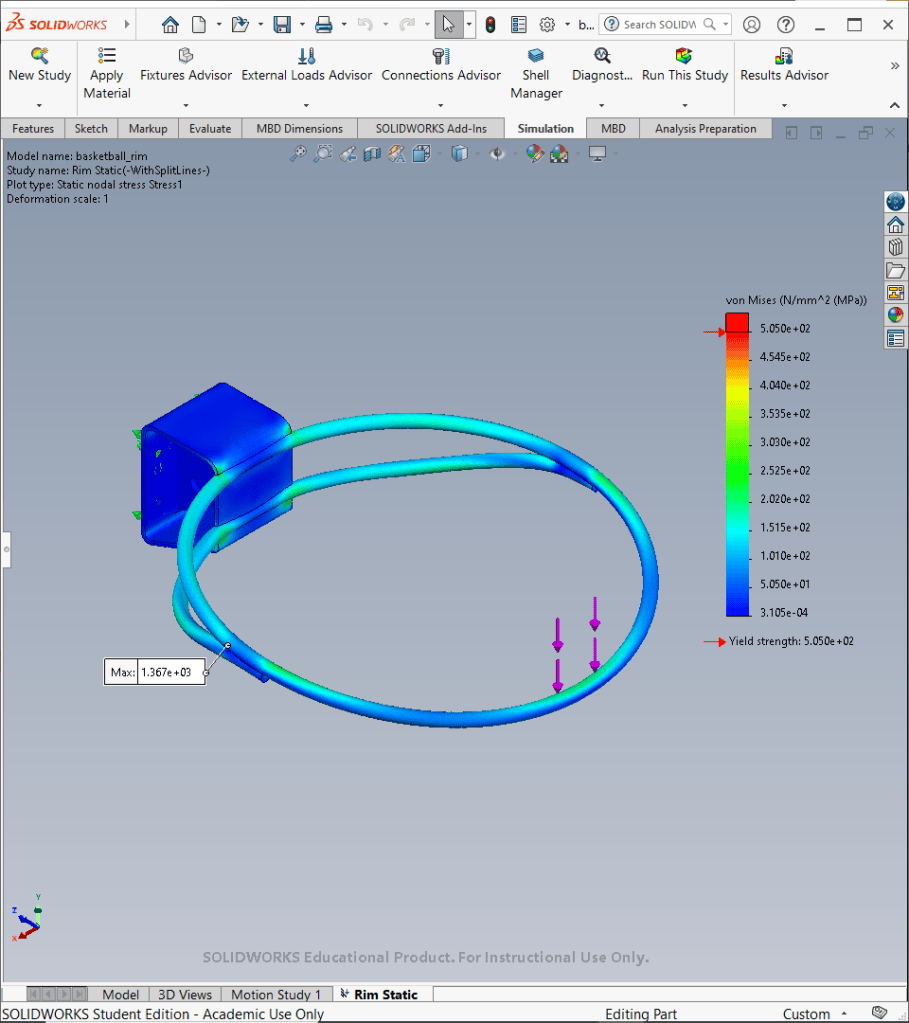
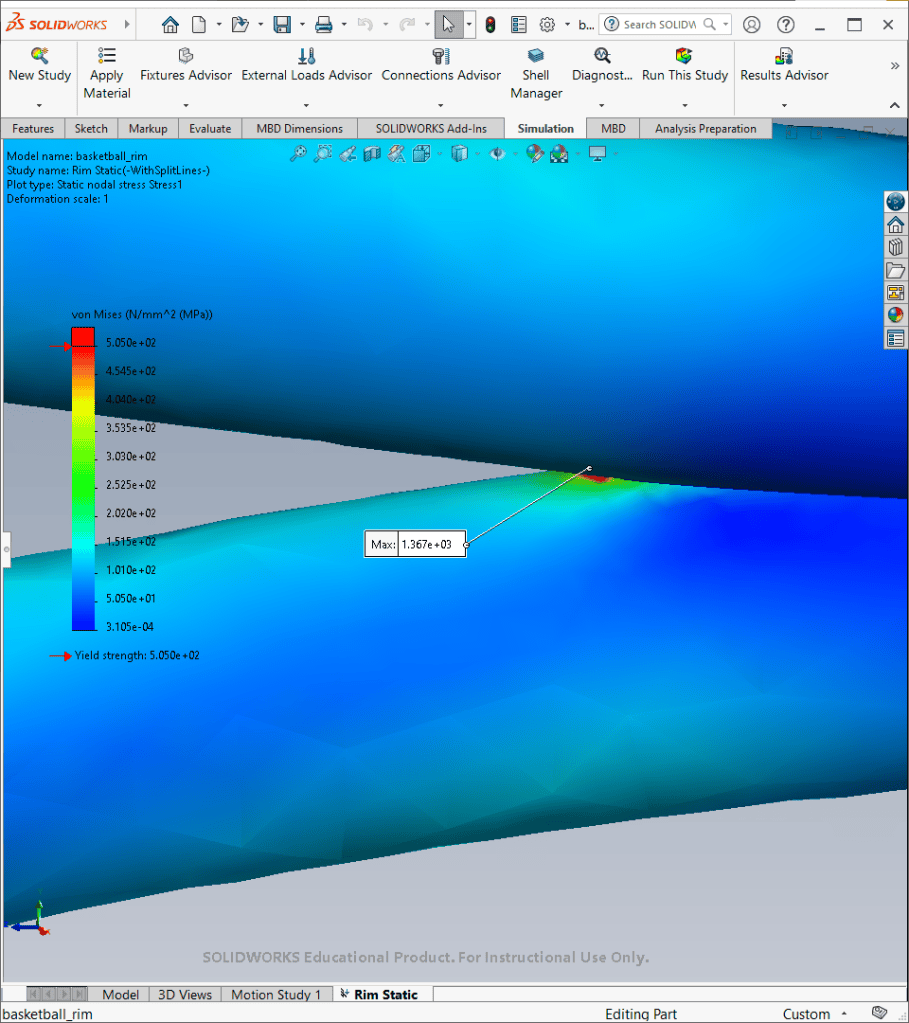
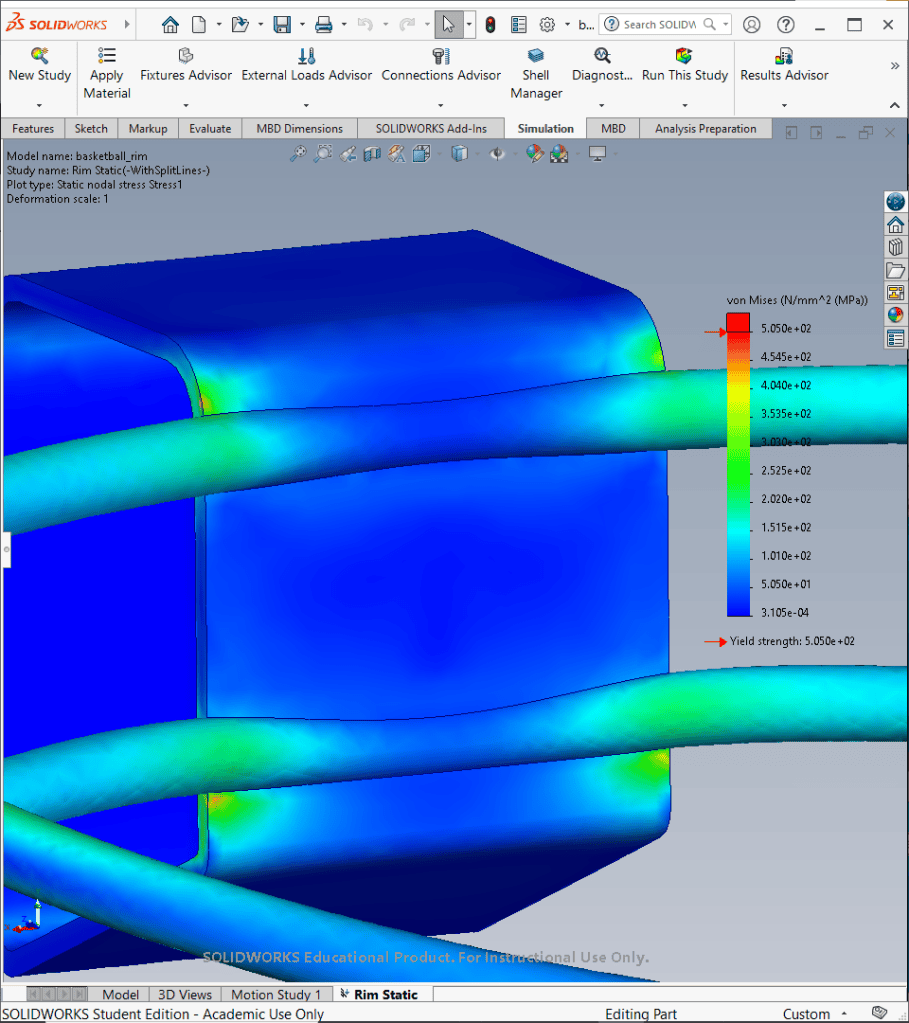
Stress plot
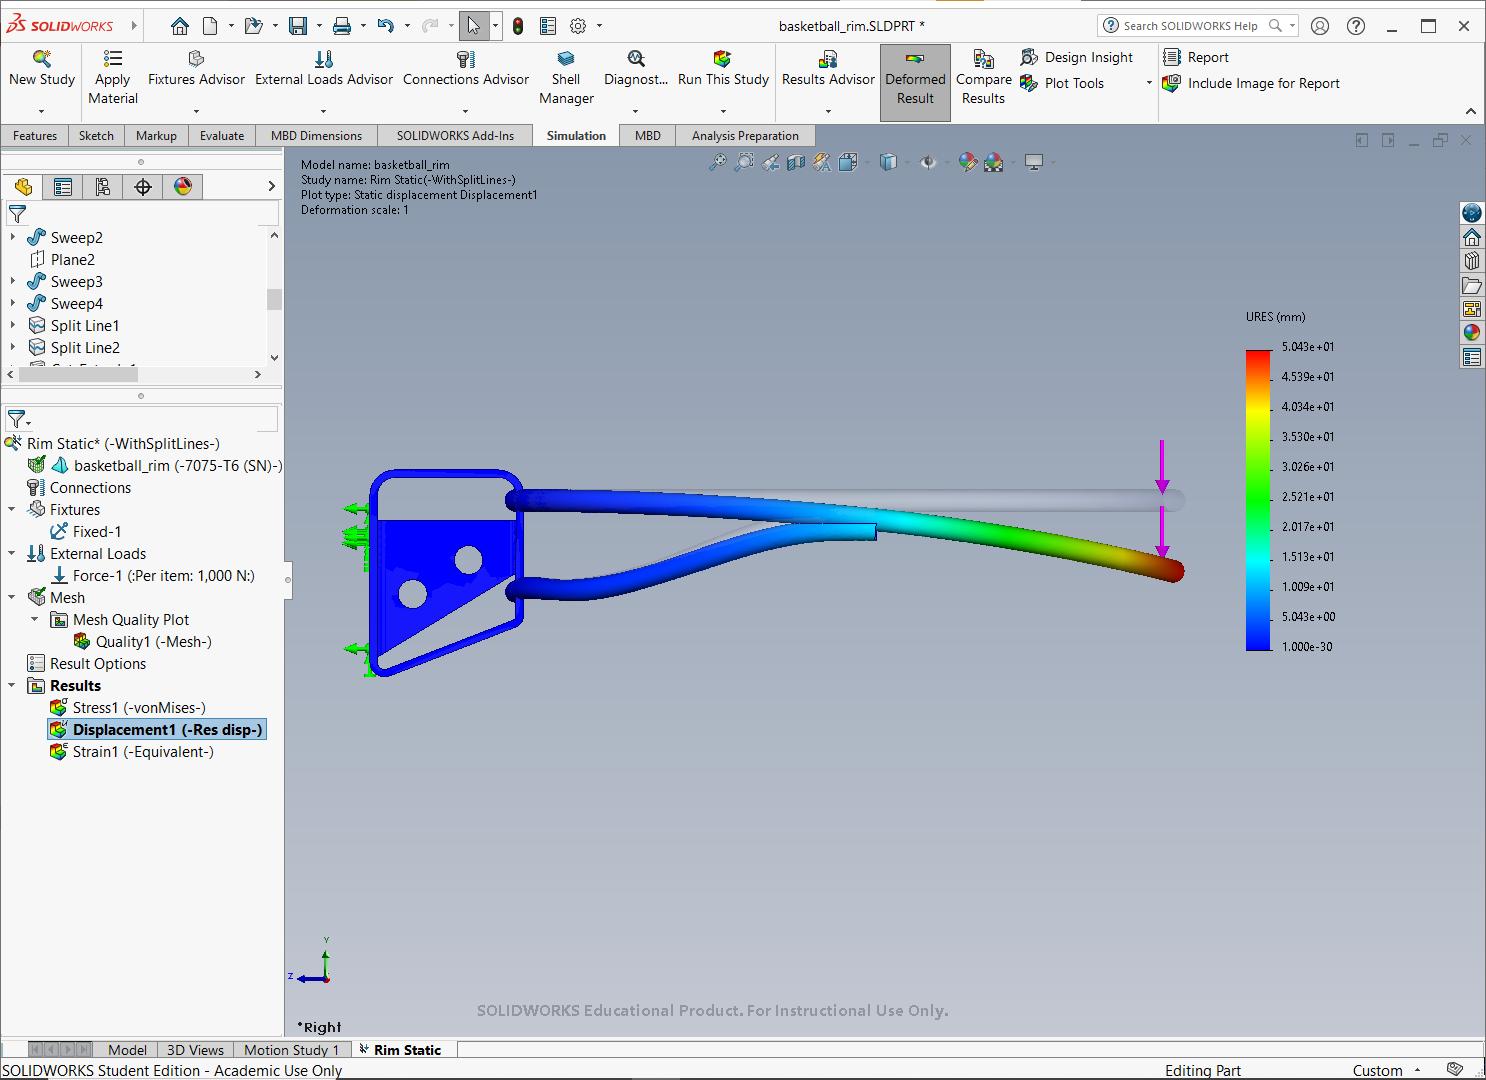
Displacement plot
Fatigue results
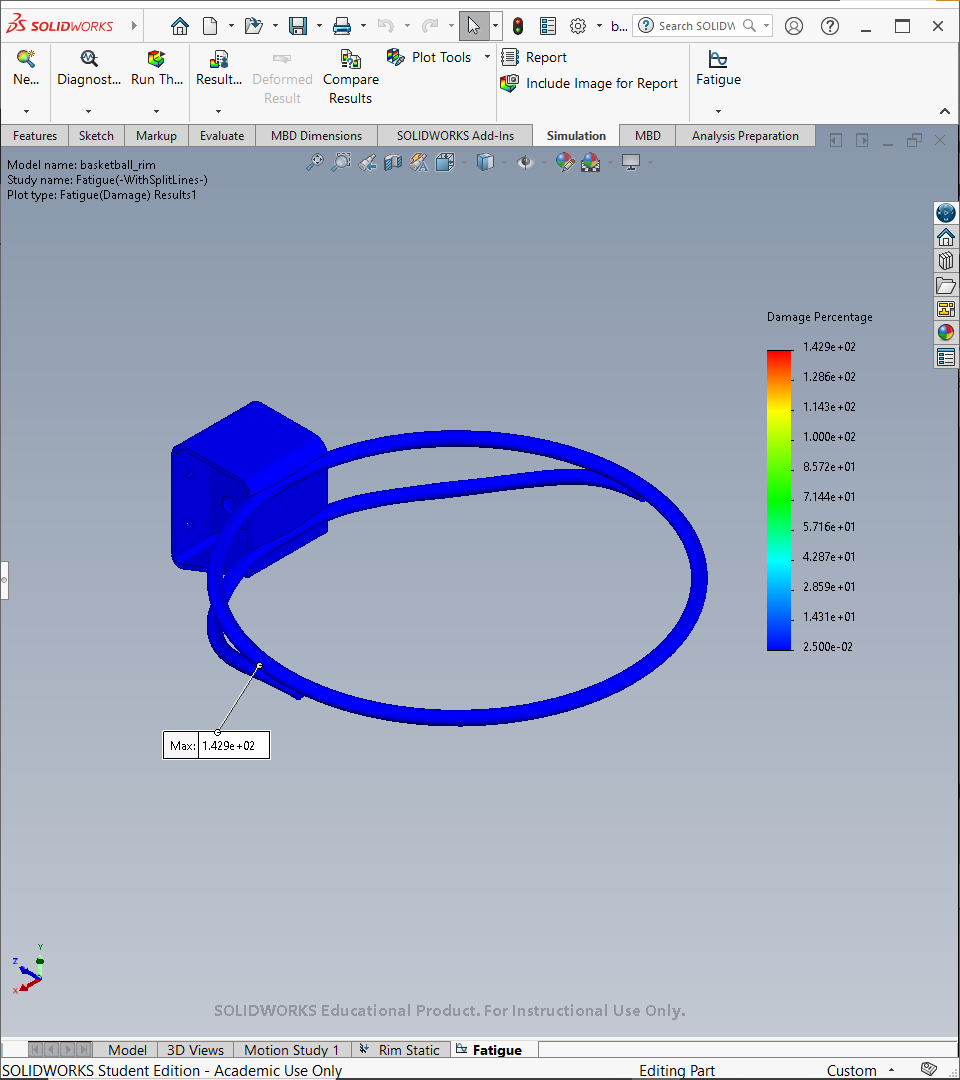
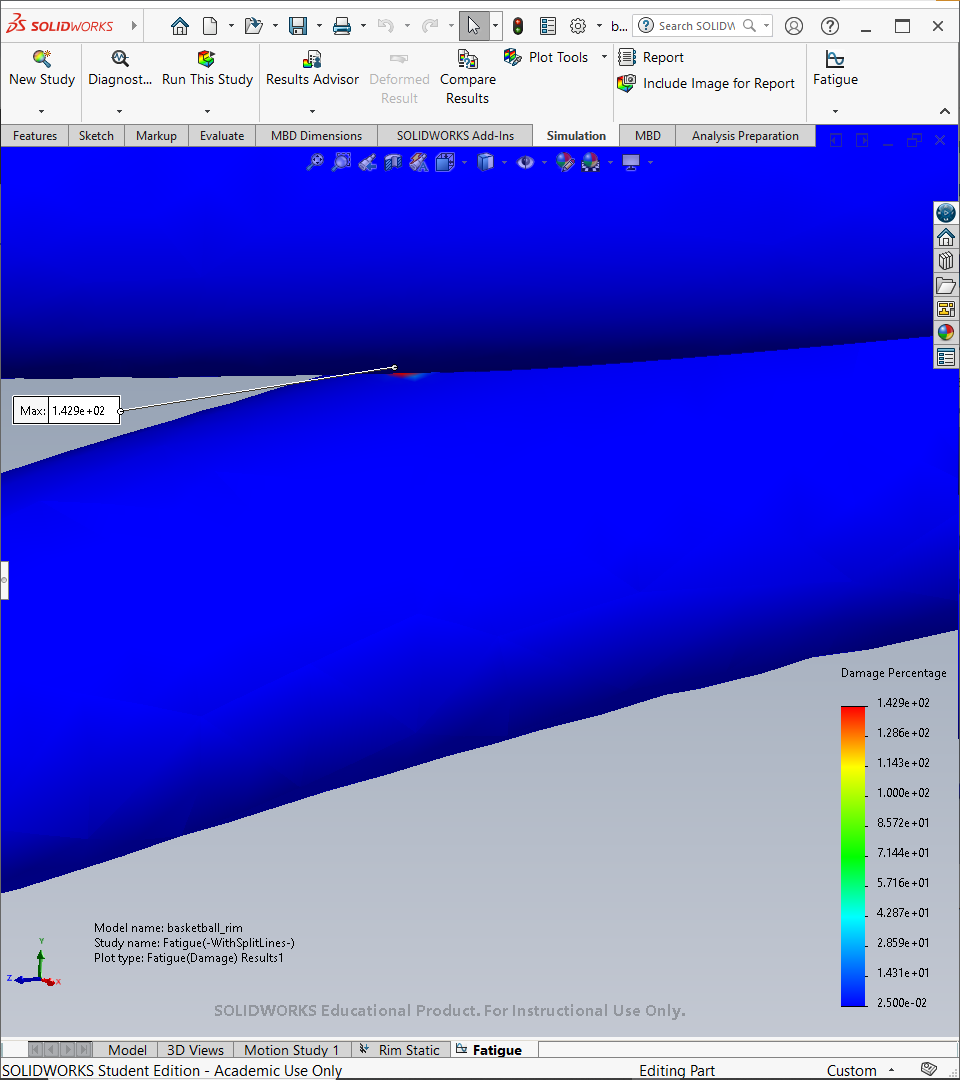
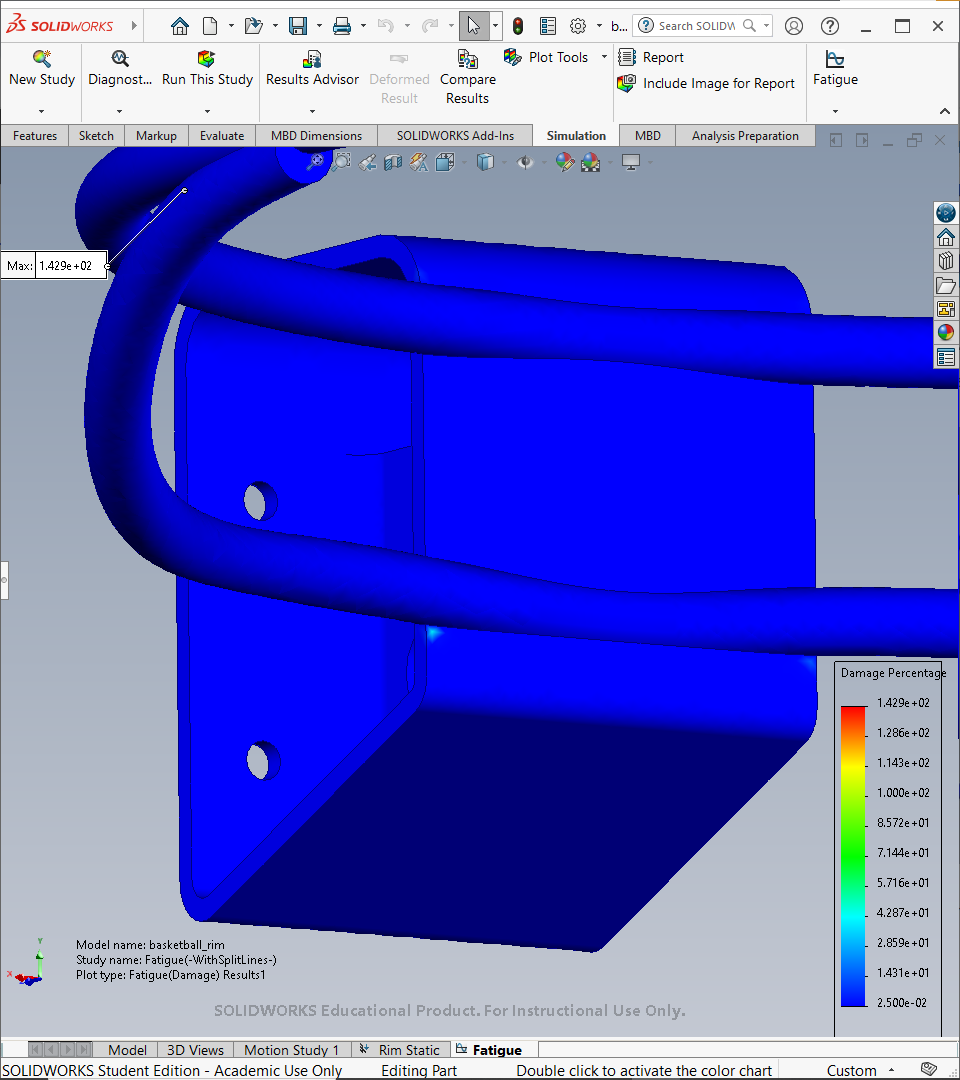
The maximum damage is about 143%*, indicating that the component will fail before reaching the total specified cycles (10,000).
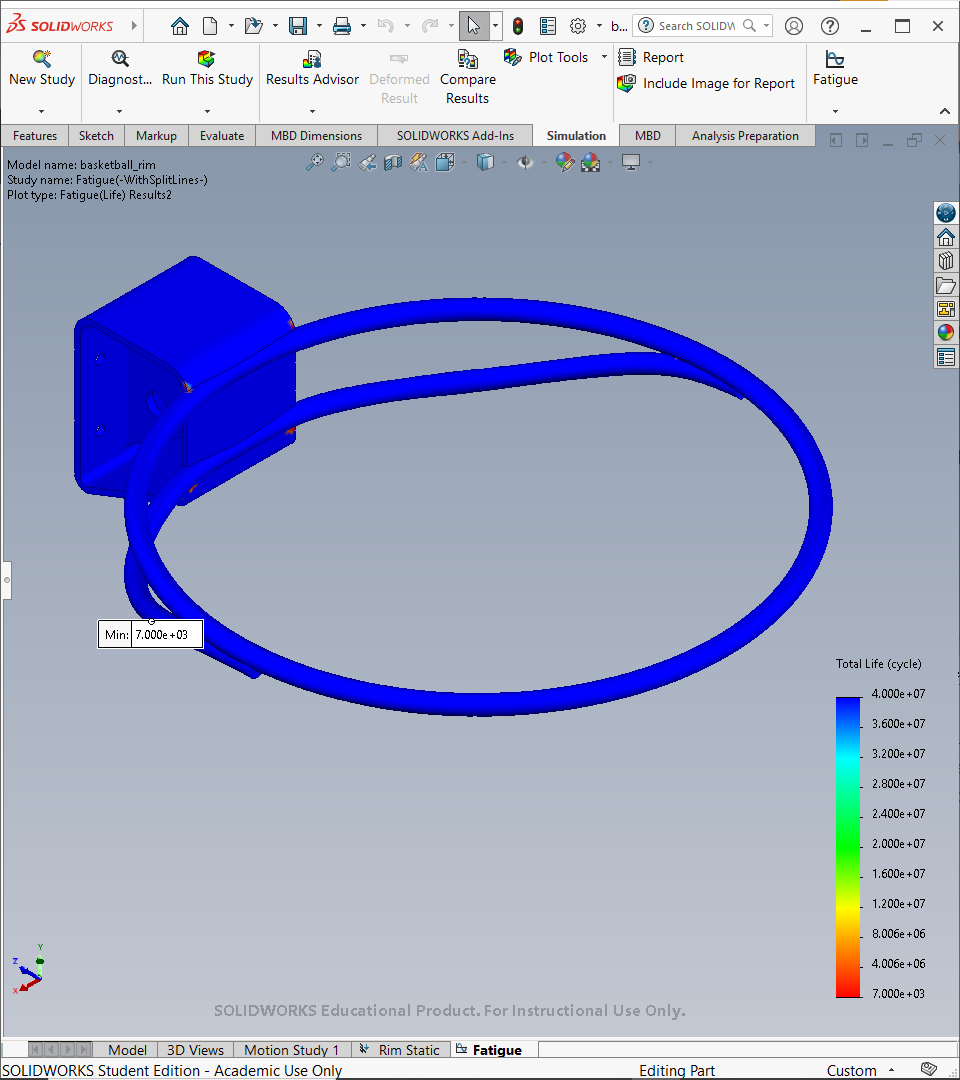
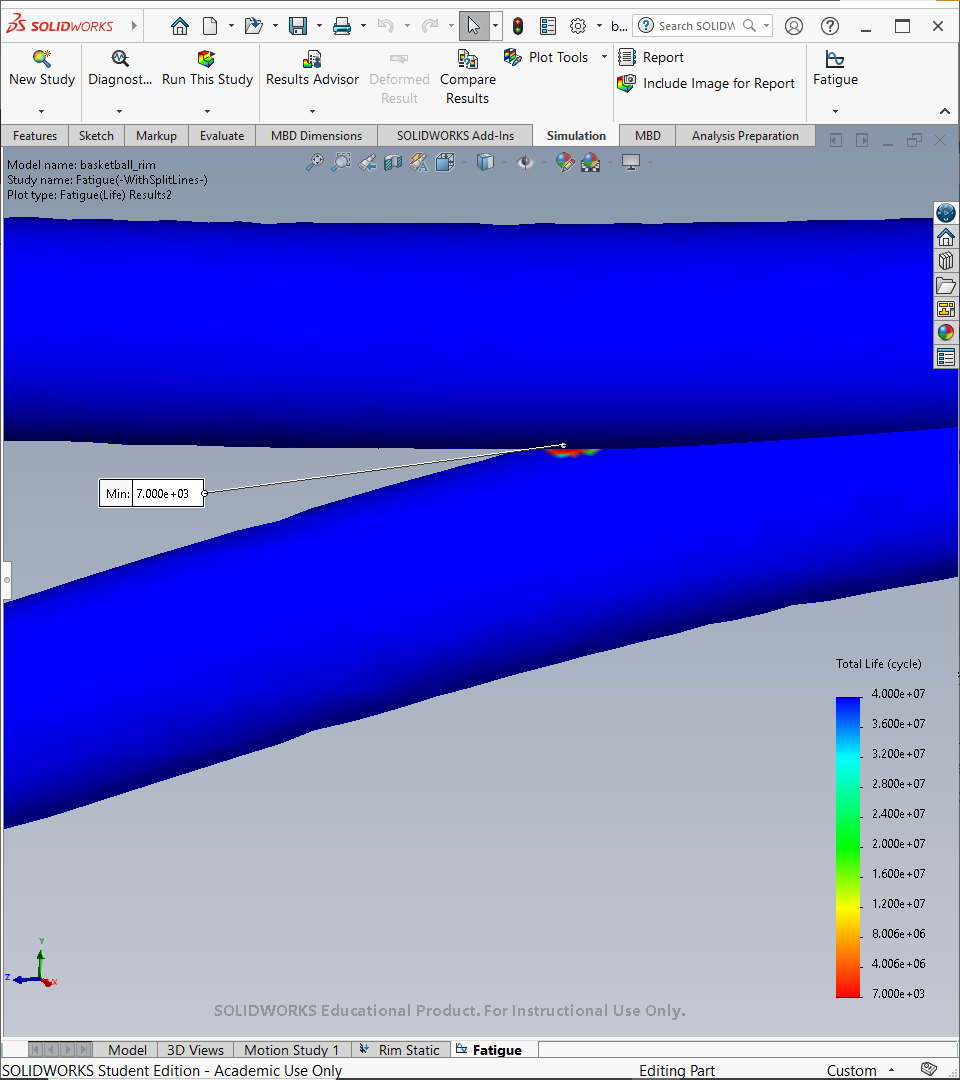
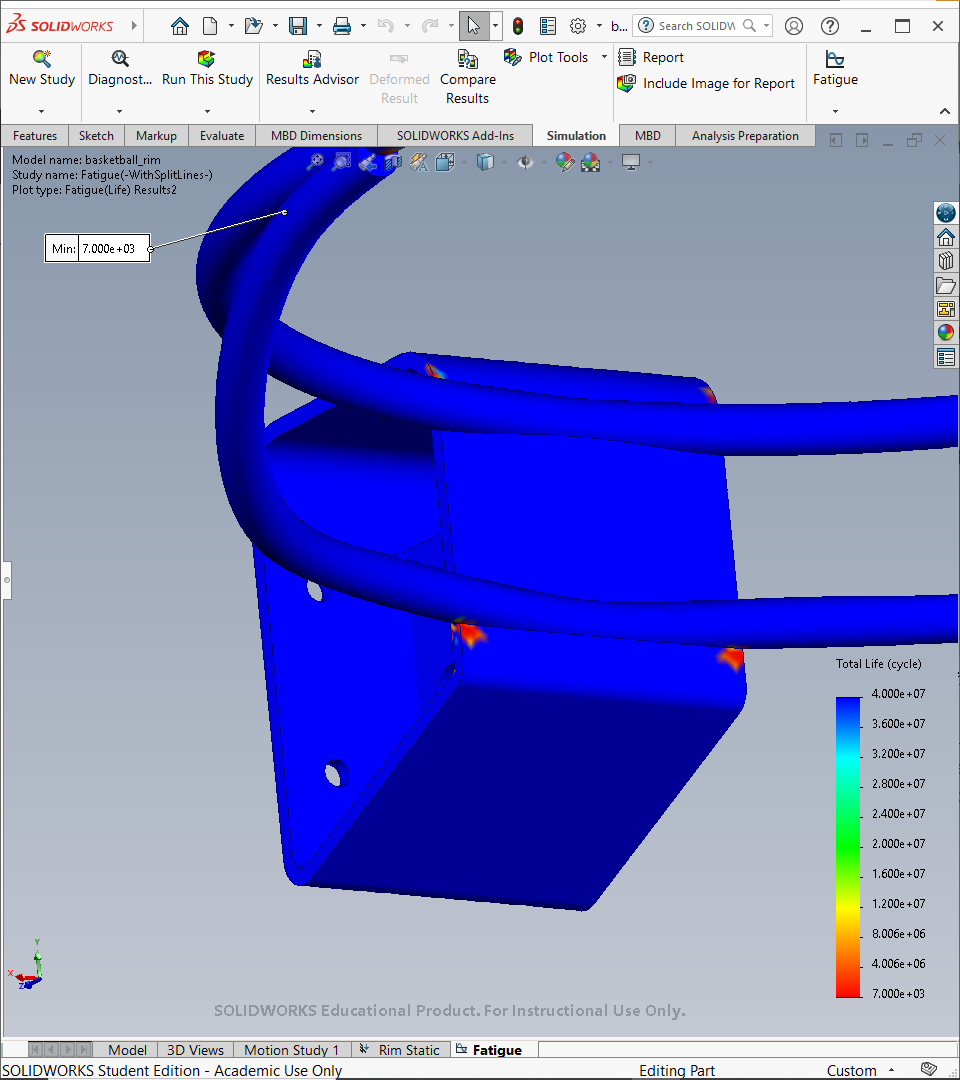
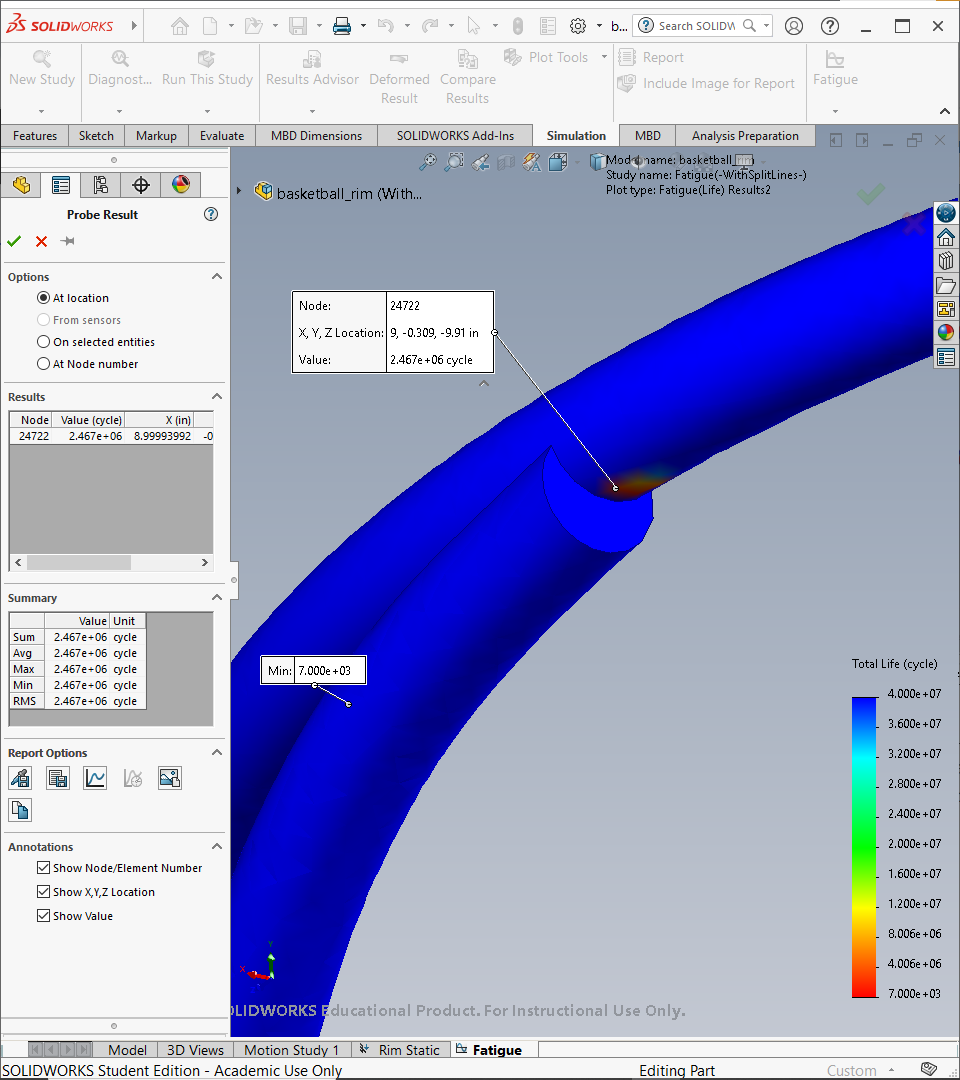
Failure occurs at 7,000* cycles.
*These results appear to be caused by the aforementioned sharp corners on the 3D model. Adding fillets representing weld beads to the model would paint a more accurate picture. That said, the four regions where the rim and supports connect to the mount also appear to be weak points, suggesting the manufacturer should pay close attention to the joints and the welds.
Source
- MySolidWorks Training
- Learning Path: SW Simulations
This content (including the analysis setup, simulation execution, and all resulting visual content—screenshots and videos) was individually performed and generated by me in SolidWorks Simulation, utilizing a combination of custom and existing parts provided by SolidWorks as guided by the MySolidWorks Training curriculum.
 Chris Wachter | Portfolio